I want to apologize for the radio silence over the past month. I’ve been hard at work at my new company and I’ve been working hard to add new features & devices to Shion. This post shares some of that work.
Energy Meters
When I started creating Shion, it was as a context-aware home automation app that not only provided a universal remote to your house’s devices, but also helped you manage those devices by making visible previously hidden data. One of the use cases I envisioned was Shion helping folks save money by automating when particular devices were active, automatically shutting down things late into the night, and so forth.
The question that I was often asked was, “Why?” One answer I often provided was “to help people save money by conserving power”. The power spend equation would look something like this:
E + (A * D1) + (B * D2) + (C* D3) … = Total Power Usage
A, B & C are the coefficients that describe how much individual devices contribute to the total power draw. D1, D2 & D3 are the time quantities describing how long an individual device was active. E is the “error” term that accounts for devices invisible to Shion, and total power usage is the number that your electric utility uses to bill you. Since Shion’s beginnings, I’ve been able to capture D1, D2 & D3 pretty easily – I just look at the event log to calculate how long devices were active in a given period. E, A, B & C were a bit more problematic.
Since I didn’t have the total power usage available for me, my problem was one that any first-year algebra student will recognize: I had too many unknowns. Depending on the total power usage, E, A, B & C could be anything. It’s like solving the for N in the following equation:
N * 3 = M
If you don’t know M, you can’t solve for N.
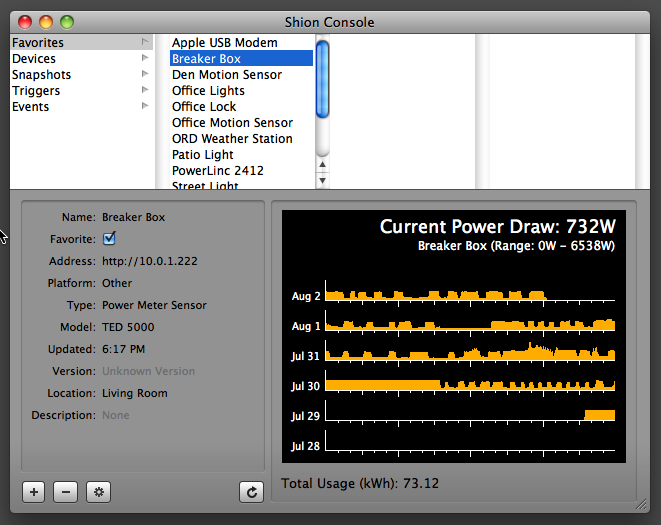
I’m happy to report that this problem is now solved. Earlier this month, I finally purchased a whole-house smartmeter that tracks my home’s real-time power consumption. I went with the TED 5000 because it seemed to be a more robust system that measured current off the main lines coming into the house using inductive measurements to calculate my power usage. (Other devices use optical readers that you place on your meter and it watches the meter wheel spin.) I’ve been using the device over the past couple of weeks and I’ve been very pleased with it.
The image above illustrates what the output looks like. From the box, I’m currently pulling two variables: the current power draw and the total usage for the billing cycle. When I started graphing the output, I noticed the strange square-wave pattern seen above. A short investigation identified the culprit: my air conditioning. I knew that A/C was a big power draw, but I had no idea that it would triple or quadruple my base usage when it was active cooling the house. That was the first thing I learned.
The second thing that I learned was that using this data to construct my model for the house’s power usage was going to be problematic since the A/C was such a dominant contributor to the usage. The A/C power draw would “drown out” other devices’ power contributions. With that in mind, I did some research on the INSTEON thermostats and was pleased to discover that the v2.x Venstar modules now support notifying other devices when the A/C comes on and when it goes off. Using that information, I can account for the large shifts in power magnitude and get back to individual devices’ contributions. (This addresses the problem I identified earlier this month.)
So now that I have both sides of my equation above accounted for, I’m currently in the process of collecting enough data so that I can begin regression analyses on my power consumption. I don’t have anything to share yet, but stay tuned for more data (& models!) in the coming weeks.
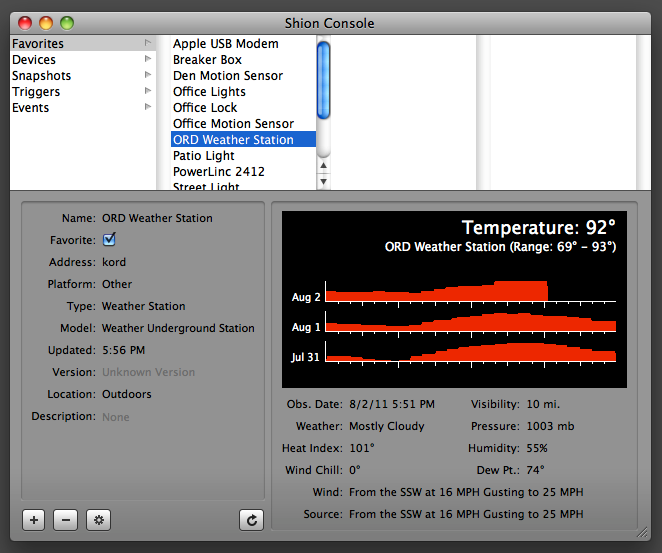
Another question the new smart meter presented me with was one dealing with the frequency & duration of my A/C usage. As the image above illustrates, there’s a distinct square-wave shape to my power usage, but no discernable pattern to the length & separation of those plateaus. In Chicago, we’ve been experiencing some typical hot summer weather, so I went ahead and added another data point to my project.
Since I don’t have a weather station in my yard that Shion can talk to (yet), I went ahead and implemented the next best thing. Using the Weather Underground API for communicating with weather stations around the world, I implemented a “virtual” weather station that would give me some data to start playing with until I had instrumentation of my own. In addition to the temperature, this new function also gets me the wind speed, barometric pressure and humidity figures. Again, I’m now back in data collection mode, but after I finish gathering a few more days of details, I should be able to run the statistical analyses I want.
So in the end what does this accomplish? A few things:
1. If I can find a statistical relationship between the weather and my A/C usage, I can quantitatively describe the relationship between what’s going on outside and how much I pay my utility at the end of the month. By doing some experiments with the cool points on the thermostat, I can begin to predict the square wave pattern seen above.
2. Using the data collected from my thermostat and the outside weather station, I can put a price tag on different possible device configurations. For example, maybe I can keep the place a degree cooler by a degree at a cost of $10 at the end of the month. Perhaps letting the thermostat go two degrees higher, I can save more. By doing repeated experiments, I can tease out the relation between those two variables. I currently suspect that if you graphed thermostat cool points on the X axis and monthly cost on the Y axis, you’d see something like a backward hockey stick. I can now see if I’m right or wrong.
3. With the thermostat data accounted for, I can begin to calculate the impact coefficients of the other devices in my house. Using these coefficients, I can begin to rank the devices by their impact on my overall consumption. Just as the A/C data has already informed my behavior, knowing what the next hungriest devices are will help me make better decisions about how and when to use them.
4. (Long term) After I spend some time learning strategies and techniques for optimizing my electricity usage, I can begin to embed them in Shion so that software can begin to help me make good electricity choices. Just like financial software helps bill crunchers manage their budgets, I see Shion becoming a valuable tool for doing something similar for electricity users.
Getting back to the short term, I have a few more things to complete, but these features will be in the next Shion release sometime in the next week or two. Again, stay tuned.


Recent Comments